HOMER Pro 3.16

Type: |
Input Variable |
Units: |
none |
Symbol: |
δ |
Typical Range: |
0.0-0.4 |
The diurnal pattern strength is a number between 0 and 1 that reflects how strongly the wind speed tends to depend on the time of day. When you generate synthetic wind speed data, HOMER assumes a cosinusoidal diurnal pattern, with the diurnal pattern strength defined as the ratio of the amplitude to the mean.
The following equation describes the average diurnal profile of the synthesized wind speed data:
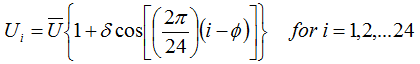
where: |
|
|
|
Ui |
= the mean wind speed in hour i [m/s] |
|
U |
= the overall mean wind speed [m/s] |
|
δ |
= diurnal pattern strength (a number between 0 and 1) |
|
ϕ |
= hour of peak wind speed (an integer between 1 and 24) |
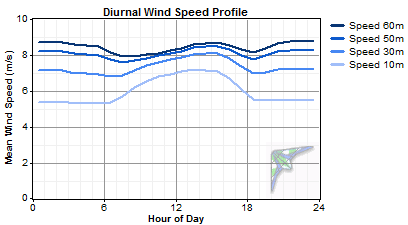
Note that the character of the diurnal pattern tends to vary significantly with height above ground. The following graph shows a typical example where, at 10 m above ground, the wind speed tends to peak in the afternoon, whereas, at 60 m above ground, the wind speed tends to peak overnight. The following graph shows data measured at a site in the Midwest region of the US.
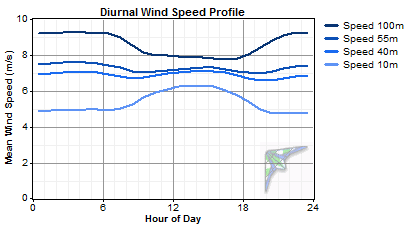
This pattern can be very pronounced, such as in the following graph, which shows mean diurnal profiles at heights from 10 m to 100 m above ground, at a location in the Great Plains region of the US. In this example, the diurnal pattern at 100 m is almost the mirror image of that at 10 m above ground:
In other cases, the diurnal pattern changes much less with height above ground, such as in the following graph.

Because HOMER uses the wind speeds to estimate wind turbine power output, the wind speed data needs to reflect, as closely as possible, the conditions at the hub height of the wind turbine. So, consider the height above ground when you specify the diurnal pattern strength and the hour of peak wind speed.
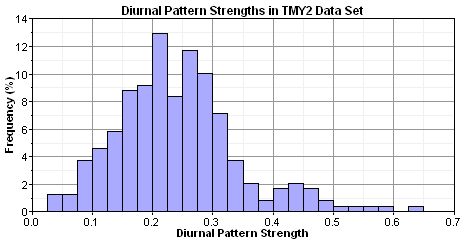
To measure the diurnal pattern strength from time series wind speed data, you can calculate the average diurnal profile and perform a curve-fit operation to find the best-fit value of the hour of peak wind speed and the diurnal pattern strength. We performed that process for the 239 weather stations in the U.S. National Solar Radiation Data Base, which record wind speeds at 10 m above ground. The histogram below shows the distribution of the diurnal pattern strength values that we measured. The measured values themselves appear in the table of measured wind parameters.