
HOMER Pro 3.16

![]()
Click the Solar GHI button under the Resources tab in the toolbar at the top of the page. The Solar GHI Resource page appears.
You use the Solar Global Horizontal Irradiation (GHI) Resource to calculate flat panel PV array output. GHI is the sum of beam radiation (also called direct normal irradiance or DNI), diffuse irradiance, and ground-reflected radiation. For more details on the equations that determine the incident radiation based on the GHI, see How HOMER Calculates the Radiation Incident on the PV Array.
Note: For concentrating PV, enter a Solar DNI Resource, instead of a Solar GHI Resource. Concentrating PV only captures DNI, the beam radiation component of GHI, and so uses the Solar DNI Resource.
Choose a Location
If you selected a location on the map in the Home page, the latitude and longitude appear here. Otherwise, you can enter the latitude and longitude manually. Select the time zone by clicking the Update button or by choosing from the drop-down menu. HOMER uses the location for several aspects of the PV power calculation, so it is important to specify the location even if you are not downloading solar data.
Choose a Data Source
The baseline data is a one-year time series representing the average global solar radiation on the horizontal surface, expressed in kWh/m2, for each time step of the year. HOMER displays the monthly average radiation and clearness index of the baseline data in the solar resource table and graph.
There are two ways to create baseline data: you can use HOMER to synthesize hourly data from monthly averages, or you can import time series radiation data from a file. If you are looking for solar data, see Finding data to run HOMER.
Click either the Enter monthly averages radio button or the Import from a time series data file or the library radio button.
Enter Monthly Averages
If you selected Enter monthly averages, you can enter solar resource data in the Monthly Average Solar Global Horizontal Irradiance (GHI) table either manually or by downloading it from the HOMER website.
•To enter twelve average monthly values into the solar resource table manually, you can input the solar radiation (in kWh/m2 per day).
•To download solar data from the HOMER website, click the Download button to automatically fill in the twelve monthly average values based on the latitude and longitude.
When there are values in the monthly solar radiation table, HOMER builds a set of 8,760 solar radiation values, or one for each hour of the year. HOMER creates the synthesized values using the Graham algorithm, which results in a data sequence that has realistic day-to-day and hour-to-hour variability and auto-correlation. For more information, see the synthetic solar data information in the help.
Import Solar Data
If you selected Import from a time series data file or the library, you can prepare your own text file containing the solar radiation data in each time step for a complete year.
Tip: You can import data with time steps of many sizes between 60 minutes and one minute. HOMER detects the time step when you import the data file. For example, if the data file contains 8760 lines, HOMER assumes it contains hourly data. If the data file contains 52,560 lines, HOMER assumes it contains 10-minute data.
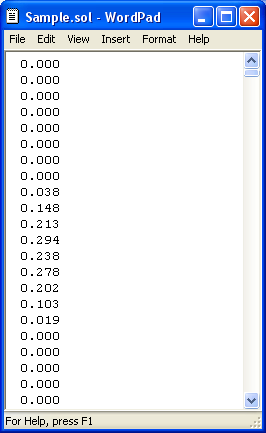
The data file must contain a single value on each line, corresponding to one time step. Each value in the file represents the average solar radiation (in kW/m2) for that time step. The first time step starts at midnight on January 1st. The following is a sample input file.
Click the Import button or the Import and Edit button to open the text file. You can import a text file with any extension.
When you import data from a text file, HOMER makes a copy of the data set and integrates it with the HOMER (.homer) file. After the data is part of the HOMER file, HOMER no longer refers to the original text file. If you modify data in the original file, you must import the modified file in order for the modification to be included in the HOMER file. After you import a data file, HOMER calculates monthly average radiation and clearness index values and displays them in the table and graph. HOMER also displays the name of the imported data file in the title of the graph.
Scaled Data for Simulation
HOMER uses scaled data for calculations. To create scaled data, HOMER multiplies each of the values in the baseline data by a common factor that results in an annual average value equal to the value that you specify in Scaled Annual Average.

To determine the value of this factor, HOMER divides the Scaled Annual Average by the baseline annual average solar radiation. The scaled data retains the shape and statistical characteristics of the baseline data, but may differ in magnitude. The default value for the Scaled Annual Average is the baseline annual average solar radiation. When the two values are equal, the scaled data and baseline are identical. HOMER interprets a Scaled Annual Average of zero to mean that there is no solar radiation.
Two reasons to use a different Scaled Annual Average than the baseline annual average are for unit conversion and sensitivity analysis.
An example of using the Scaled Annual Average for unit conversion is to convert data from an imported file that contains solar radiation data expressed in Wh/m2 rather than kWh/m2. If the baseline annual average is 4800 Wh/m2, enter 4.8 in the Scaled Annual Average box, so that the scaled data is equivalent to the baseline data, but expressed in kWh/m2: 1 kWh/m2 = 1000 Wh/m2.
Note: To the right of the Scaled Annual Average input is a sensitivity button ( ) that allows you to do a sensitivity analysis on that variable. For more information, see Why Would I Do a Sensitivity Analysis?
See also
